Non-IAB Members can access the Executive Summary and IAB Members can access the full report in the “Downloads” section below. Please note members logins are now via your Email – if you are unable to access the report please contact iabaustralia@iabaustralia.com.au for a copy.
The data comes from IAB Australia’s Online Advertising Expenditure Report which is prepared by PricewaterhouseCoopers. The full report is available to IAB members on www.iabaustralia.com.au.
While all online advertising segments experienced double digital growth in the 12 months ended 31st December 2013, the General Display advertising sector had the strongest growth at 28.4 percent year on year to break the $1bn barrier for the first time. By comparison, Search and Directories grew 18.1 percent and Classifieds grew 10.5 percent year on year.
General display advertising expenditure for 2013 was $1.125m, while Classifieds advertising was $743m and Search and Directories reached $2.118m.

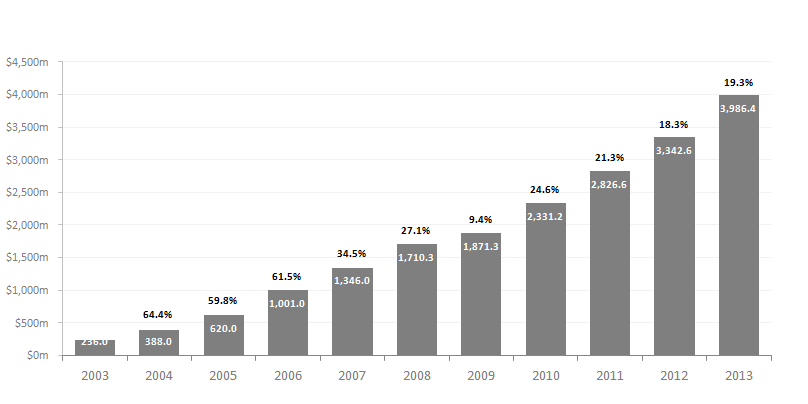
Total online advertising expenditure growth
Mobile advertising quadrupled in 2013, increasing 305 percent year on year to reach $349.2m in the twelve months ending 31st December 2013. In the December quarter it represented 14.3 percent of total online expenditure, up from 11 percent in the previous quarter. Video advertising reached 15 percent of display revenues in the December quarter, a 72 percent growth on 2012. Display advertising also experienced particularly strong growth in the December quarter, reaching 35 percent year on year growth.
Gai Le Roy, IAB Australia’s Director of Research commented: “The industry should be very proud of these strong results, particularly given the 19.3 per cent growth rate is actually an increase on last year’s. Digital advertising continues to evolve in terms of offerings and its ability to demonstrate strong ROI for marketers so we expect to see the growth rates sustained for some time to come.”
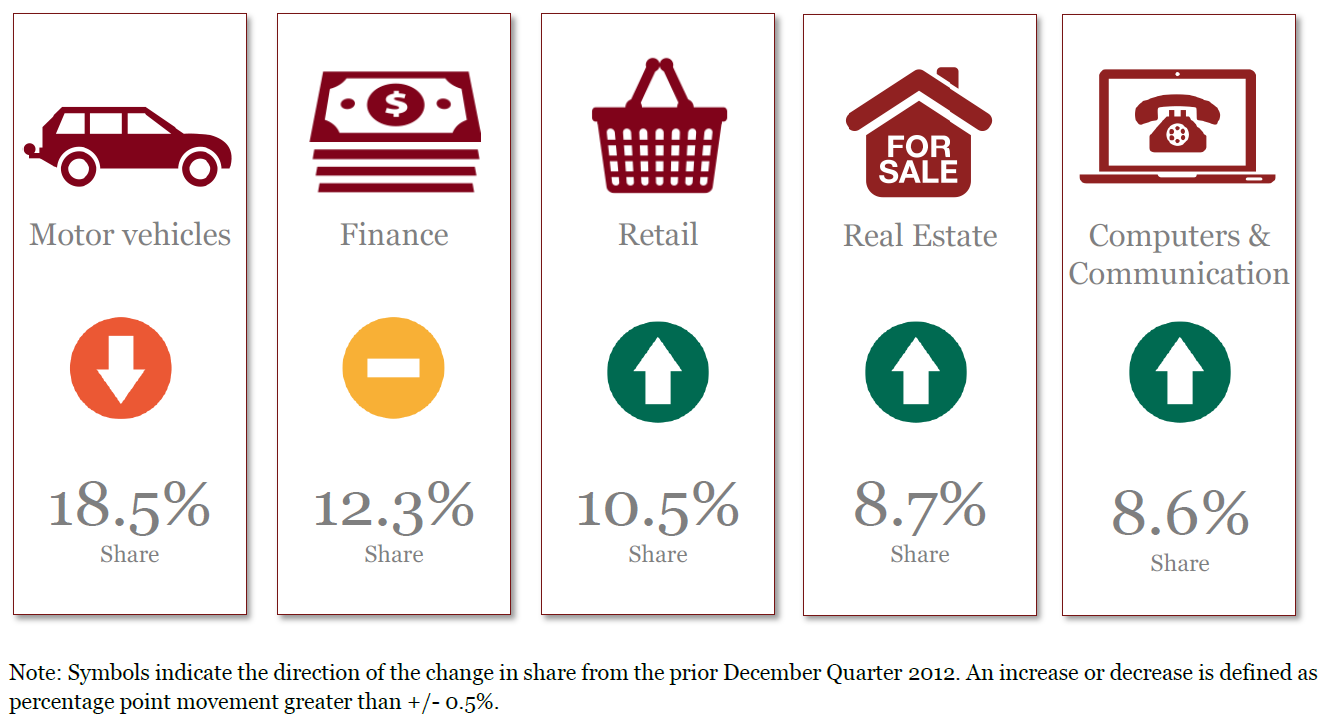
Motor Vehicles, Finance, and Retail were the top three dominant General Display industry categories in the December Quarter, representing 41.3 percent of the reported General Display advertising market. This was up from 40.2 percent in the December Quarter 2012.
Retail was a big mover this quarter, increasing its category share from 8.8 percent in the December Quarter 2012 to 10.5 percent in the December Quarter 2013. This has been the strongest quarter for retail category share since the commencement of industry category data collection in 2008. The strength of the retail industry category for General Display advertising this quarter was also reflected in the greater retail movements in the market. Shoppers spent a record $22.6 billion in December 2013, following strong sales in October and November.
“As a committed shopper – online and offline – I’m thrilled to see Australian retailers more actively marketing through digital channels, as the growth in their share of online advertising shows. The bar has been raised perhaps by the big international brand retailers that are seeing Australian consumers as attractive targets,” said Megan Brownlow, Executive Director at PwC Australia.

This Report was prepared under the “New Approach” introduced in the June Qtr 2012 OAER. The data collected from industry participants has been supplemented by:
- Estimates for Google display, video, and mobile advertising as well as estimates for Facebook display and mobile advertising
- Refinement of prior methodology used for estimating Google search; and
- Historical mobile advertising data collected from industry participants from March Qtr 2011 combined with estimated Google mobile advertising, to provide a picture of the aggregated mobile advertising market and the growth trends.
Comparative data for the period from September Qtr 2010 has been restated to be consistent with the methodology changes. From time to time, estimated revenues are updated as new information and data sources become available. This may cause a series break in the data and should be taken into account when considering historical trends.