Just because Australian politics seems to be driven by opinion polls, that doesn’t mean you should run your advertising the same way. As Australia puts itself through an election, Eyeota’s Trent Lloyd, says data counts – but how reliable is the data you are using?
If political polls were doing their job, the results of an election would never be a surprise. But they are.
Take the UK’s last General Election, for example. Pollsters forecast it would be too close to call, yet the Conservatives won by a strong majority, claiming 99 more seats than Labour. The Scottish National Party also did better than anyone could have imagined. The results differed enormously from polls taken in the run up to the election. The only indication that the Tories would enjoy a landslide was when the polls closed and the BBC announced the results of an exit poll. So, how did the earlier surveys get it so wrong?
The answer was simple. The sample didn’t reflect a broad section of the voting public. An independent inquiry[i], launched to investigate the failure of the polls, suggested that, even though samples were large, there were sizeable chunks of the population under-represented – in particular older voters and Conservative supporters. In fact, those who would vote for the incumbent government were harder to contact – requiring repeated phone calls. If the pollster abandoned an evasive contact they were probably discounting a sample of Tory voters.
Imagine if your ad campaigns were run like that? If you used a data set to determine the placements what would reach your target audience, but there was an anomaly that skewed the outcome. And the problem with data is, particular when it relates to behaviour, you can never be sure what that anomaly is. Could you be applying a profile, assuming everyone who fits a particular demographic behaves the same? What if there are geographic factors that need to be considered? Or ethnic factors? Or political allegiances?
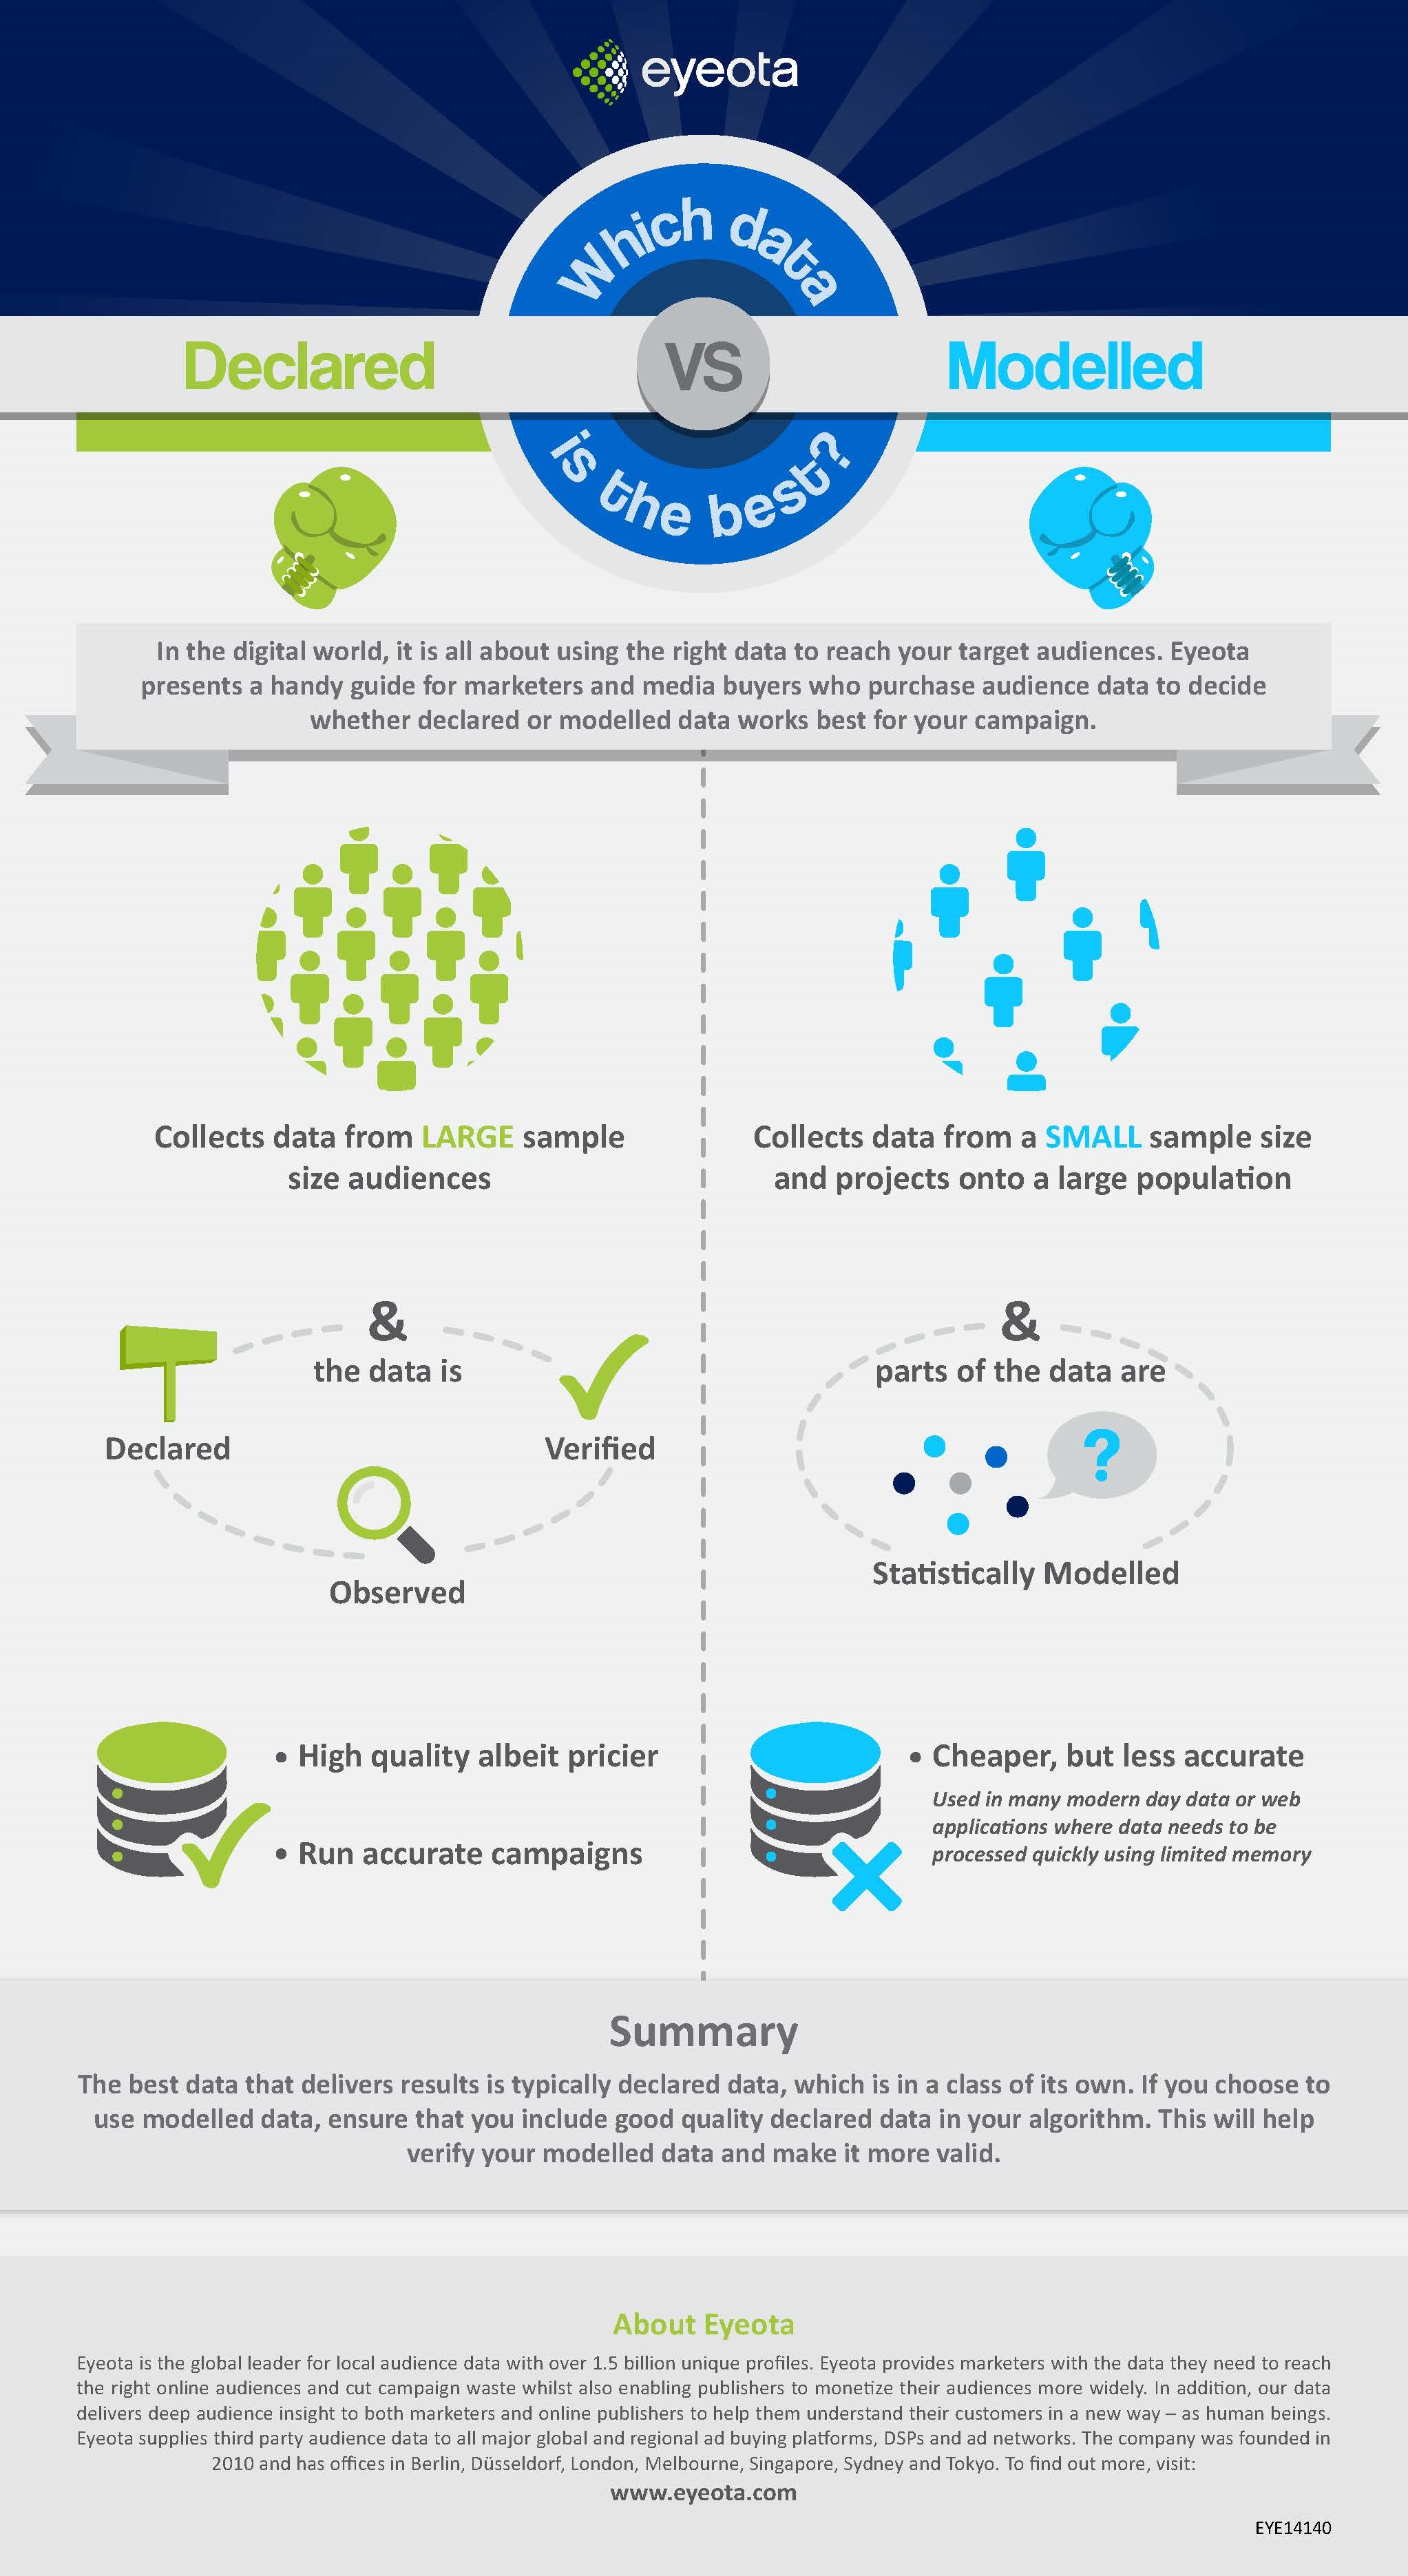
As this infographic demonstrates, there’s a world of difference between ‘Declared’ data, which uses large data samples, and ‘Modelled’ data, which draws inferences from smaller samples. If you rely on modelled data you need to be constantly vigilant, asking yourself which factors could skew your sample. Thankfully, as we all develop richer datasets the risks are reduced. Returning to our election analogy, you’ll be working on the 100% accurate final poll results, rather than the error prone opinion polls. Basically, the more data the better.