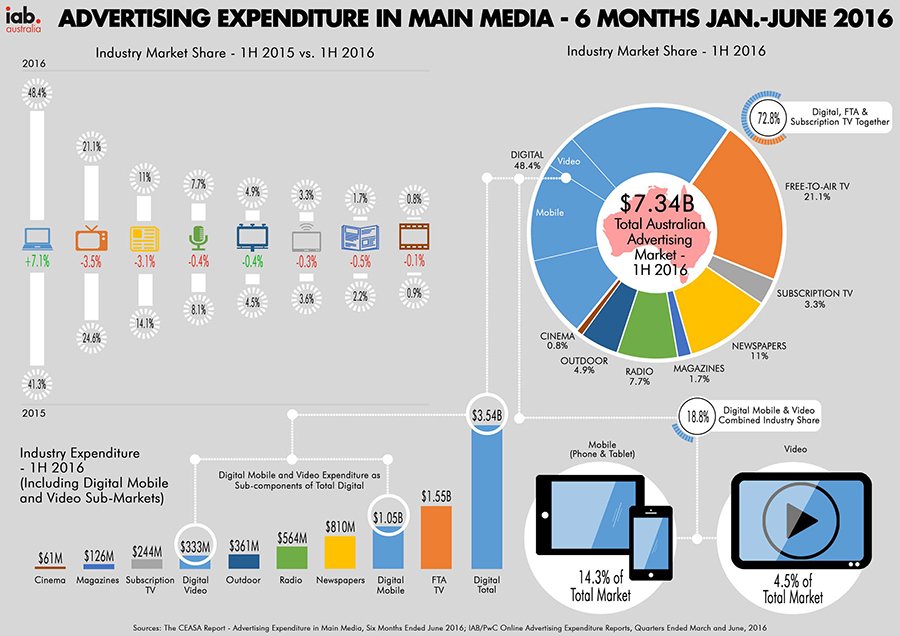
Earlier in October the Commercial Economic Advisory of Australia (CEASA), the organisation that collates advertising revenue from all the different media channels, released the results for the first half of CY2016 with the numbers revealing a strong Australian advertising market worth $7.3B. The digital share of the market increased from 41.3% in January-June 2015 to an incredible 48.4% for the same period in 2016. This would indicate that digital is on track for close to a 50% market share for the complete calendar year. (The digital data in the CEASA report is sourced from the IAB Australia/PwC Online Advertising Expenditure Report, the full report can be downloaded by members here.) Whilst digital and outdoor media were the only two channels to increase market share, free-to-air TV (FTA), radio and cinema all show growth in revenue.
The market is really becoming dominated by screens with nearly three quarters of the dollars in the market going to either digital or TV (FTA and subscription). Indeed, much of the innovation in the outdoor market is coming through digital screens and outdoor is rapidly changing its historic business models to make better use of available data and programmatic trading, increasing inventory and driving investment and revenue.
Now that digital is such a large part of the paid advertising market it is important to delve into the detail to see what is driving growth and how that fits into the total market. It has been well documented that most of the growth in the local digital market is being driven by mobile and video advertising, and these represented 14.3% and 4.5% share of the total Australian ad market in 1H 2016. These have become large market segments in their own right, quickly outgrowing their roles as just sub markets of the larger digital pie.
Currently the revenue data for digital video is focused on desktop revenue and video on mobile is reported with the mobile data; these will be broken out as a separate line item in coming reports. The IAB U.K. has recently released their H1 2016 results which highlight the rapid growth of video on mobile devices with revenue up 129% on the same period in 2015. The U.K. data also details the continuing growth of ad revenue within social media environments, which was up 43% on 2015. The IAB in the U.S. has just released their HY results which show similar growth patterns for video (up 51% on all devices) and social (up 57%).
It must be noted that not all sectors of the digital market are growing at the same rate and there are a number of factors driving these different growth rates, primarily:
- changing media consumption habits (minimal desktop growth compared to mobile’s continued growth)
- introduction and expansion of new ad formats
- supply and demand issues
- media buying models and processes.
As digital becomes a larger and larger part of the pie, the IAB looks forward to playing an increasing role in helping publishers, agencies and advertisers understand both the reach and the impact of digital advertising activity in the total media and marketing mix.
Download the Infographic here.