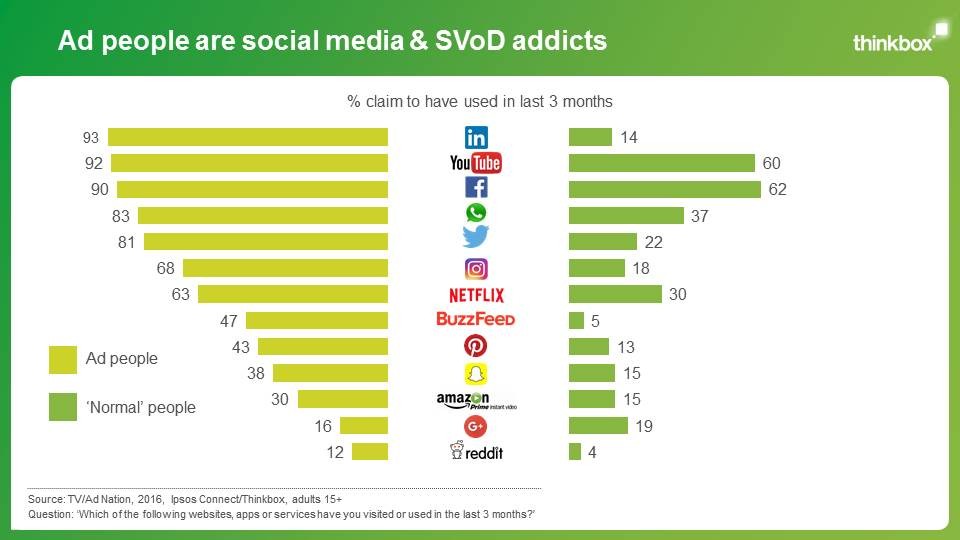
At the AdNews Media & Marketing Summit last week Professor Ritson displayed a chart that did the rounds in the UK mid last year, looking at the habits of ad industry folk compared with the general population, put out by the TV lobby group Thinkbox. This research is interesting but always baffles me a little because of two reasons:
1. It is not surprising that industry people are different
2. Buyers plan on audience measurement/ratings data not their own behaviour.
I don’t know about you but I actually find this chart really uplifting – in an era where we hear a lot about skills shortage in the industry, seeing evidence of an industry that is engaged with a variety of different media choices is quite encouraging. I could argue about some of the methodology here and I am very suspicious on some of the low levels of reach for the consumers over a three-month period in the chart, but that is not the point I am trying to make here.
Having worked in the media and ad industry for a long time, I have always been aware that people in my work sphere are very different in their media consumption to the overall population, and that is exactly why I am drawn to this industry. If you carried out the same survey on non-digital channels I would imagine that you would get the same sort of difference in behaviour between groups if you accounted for age.
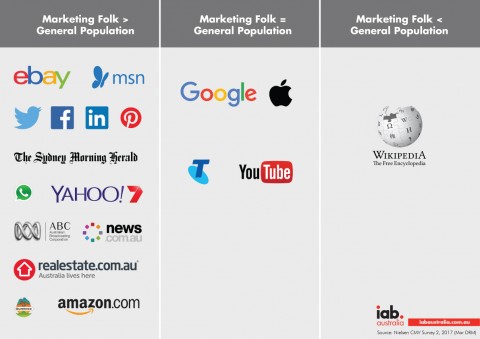
If we look at Australian data for digital media consumption we find that of the top 20 digital media brands, marketing professionals over-index for 15 of these brands*. This is based on tracked behaviour for one month rather than claimed. Interestingly the only brand where our profession under-indexes significantly is on Wikipedia – possibly we are industry of people who either like different sources or are a bunch of know-alls.
Naturally media and marketing people are interested in media and marketing channels, much like people who work in the auto industry would be more interested in cars. In fact you could argue that it is part of their job to be aware and across emerging marketing options.
However, I suspect the point that people are trying to make by using the chart is that people shouldn’t make planning decisions based on their own behaviour. Call me crazy but I imagine that is why we have ratings and independent measurement for all media channels, whether it be OzTam for television or Nielsen for digital ratings. The media industry spends a lot of time and money creating representative ratings systems to avoid people planning in a void or based on their own behaviour. If you hear of a media buyer just creating a plan from their own media choices let me know and I will personally go and give them the scoop on audience measurement research.
Judging by the links on some of the trade sites last week, it looks as if the UK research is being replicated in this market – I would hazard a guess that the two groups (industry and general population) will again look different and that thought makes me very happy.
BONUS MATERIAL
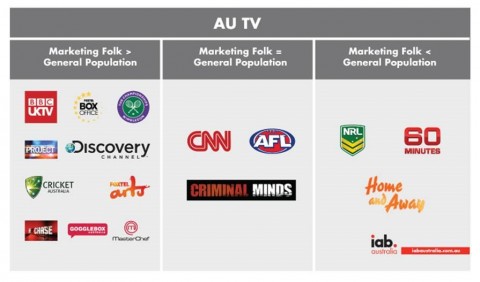
Following on from a lot of industry discussions I have had on this piece I have pulled out some data on TV consumption habits of the marketing community. Again we are avid consumers of media and our habits like quite different to the rest of the population, again this makes me happy. I have pulled out a few key programms and pay TV channels in the table below. We love tennis, cricket, watching amateur cooks (MasterChef), watching people watching the content we buy against (Gogglebox) and probably the least surprising result considering the make-up of our industry, UKTV.
I’m on the lookout for a media buyer who has a proven track record in creating media plans for clients based only on their own personal media habits. Have you met one? No? Nor have I. Today more than ever, buyers plan on audience measurement and ratings data. It’s a fallacy, and frankly a little insulting, to suggest they do otherwise. So while we might live in a bubble, it is a clear one that allows us to look outside.
- * Source: Nielsen CMV Survey 2, 2017 (Mar DRM)