Over the last 12 months a small group of publishers along with IAB Australia and Nielsen have invested significant dollars and time to work on an audience measurement solution for reviewing consumer mobile behaviour in the Australian market in preparation for a market solution being rolled out in 2015. The investment made by Facebook, Google, Fairfax Media, News Australia, Southern Cross Austereo, Telstra, TEN and Yahoo7 benefits the whole industry and will provide a new level of confidence in the market for mobile advertising. Details of the market solution roll out can be found on my last blog piece.
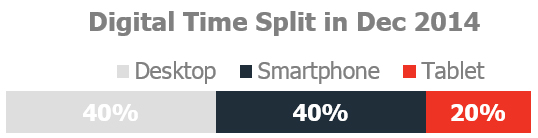
A bit of an update on some of the topline data from the smartphone and tablet panel which is tracking the behaviour of nearly 2,500 Australians. There are now 12 million Australians aged 18-plus going online via their smartphone each month and 8.5 million using their tablet for this purpose. In December, an increasingly mobile-heavy month due to the holiday period, people on average spent 33 hours and 17 mins browsing or using apps on their phone and 23 hours and 48 mins on their tablet. The figure below shows that the total digital time bucket in December had an equal split of time between desktop and smartphone with 20 percent being on tablets. From most of the data that we are seeing both from the panel and Nielsen Market Intelligence data, there has been a slowdown in tablet usage growth over the last six months.
The split of time between browsing and apps has been discussed a lot in local and overseas markets – for December data, 78 percent of smartphone time was spent in apps and 60 percent on tablets. There is no doubt that apps are the dominant mode particularly on phones and consumers tend to stick to under 10 apps they use frequently however these numbers also mask a much broader range of content being accessed via these apps. As consumers increasingly discover content through a variety of sources rather than going direct, social networks being the most obvious example, there is a range of different content being viewed within applications that will have addressable media opportunities for the market. The industry is currently reviewing technical solutions to be able to review this in-app behaviour at a market level.
IAB in the US recently published a report on consumer perceptions on browsing versus app behaviour titled Apps and Mobile Web: Understanding the Two Sides of the Mobile Coin which investigates some of this “app gap” that we are seeing in measurement systems that is well worth reading. The study shows US mobile internet users’ perception of their usage of apps and mobile websites diverges from the time-spent data.
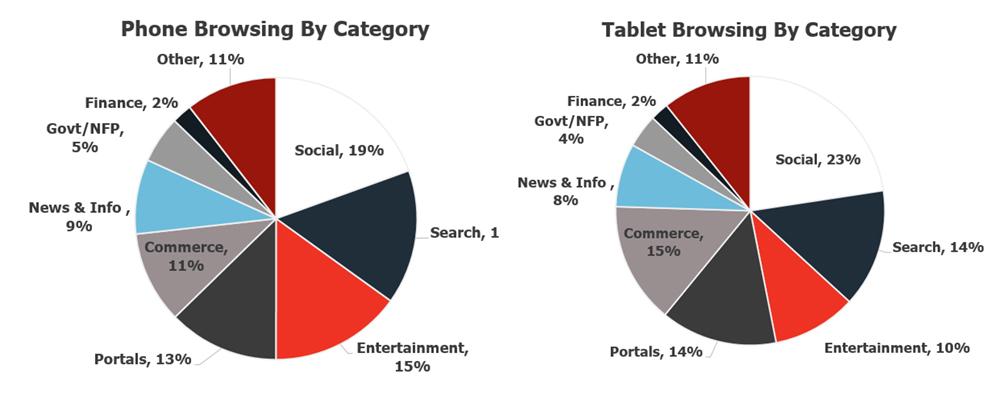
App time is dominated by social and game with Facebook representing a good chunk of that time. Browsing behaviour is more diverse and the charts below detail the split of category time for phone and tablets for December 2014. Although the splits between phone and tablet are not incredibly different there are probably two main differences – commerce is representing a significant 15 percent of time on tablets and entertainment is skewing higher on phones mainly driven by more adult activities!
Again I would like to thank the sponsors of this project and we are very excited to see a broader solution in market this year.