The interweb is becoming an increasingly visual medium. The rise of image driven platforms such as Instagram, Pinterest, Snapchat, the increase of video consumption, and the increasing use of content card layouts for websites, are all testament to that.
And so it is natural that with the growing volumes of data we are creating each day that data visualisation has emerged as its own discipline. Typically data visualisation is about making sense of big data. But brands can also benefit from presenting their small data or numerical information visually.
Here are three examples of small data visualisations that have helped me plan my upcoming trip to Europe:
Qantas Frequent Flyer Status
Consumer need: What do I need in order to maintain my current Frequent Flyer Silver Status?
The answer to this question involves the combination of three different variables:
• Status credits earned
• Timeframe
• Eligible flight segments.
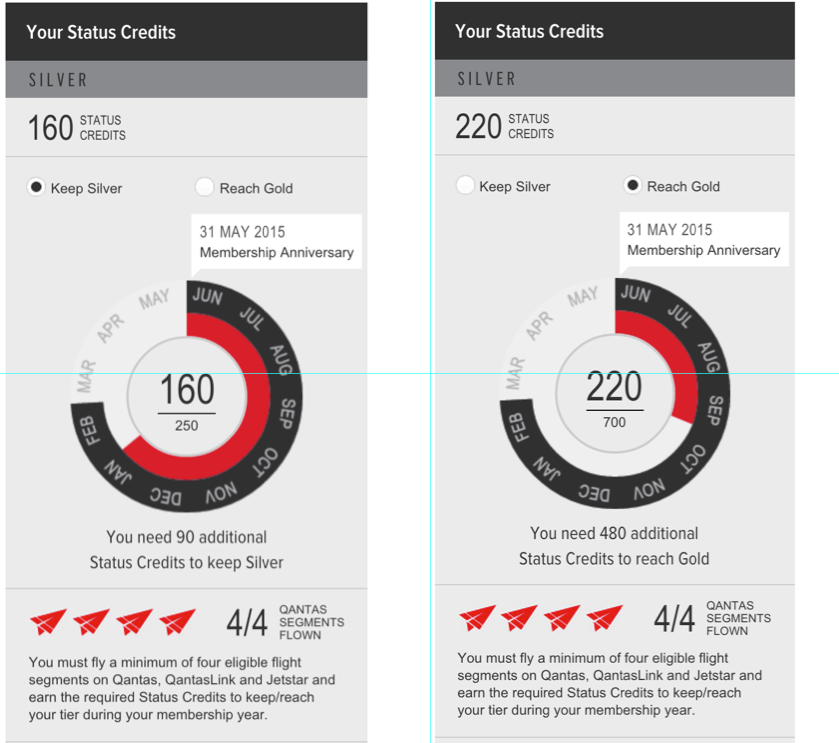
Qantas does this well. Looking at the left hand side image I can see that:
• I need an additional 90 status credits to maintain my Silver status
• I have three months remaining to obtain these credits
• In terms of the pace I am earning status points, I am slightly behind.
• I’ve already met the four flight segment eligibility requirement
So after flying this week and earning more status credits I’m curious as to what it would take to reach Gold status (see right hand side). It is pretty clear that unless I am planning on a number of international flights between now and the 31st of May to attain the 480 additional status credits required, I am not going to reach gold status.
I like this solution from Qantas because it gives me the information I need and clearly shows me the relationships between the timeframe and status credits. Much easier to understand than how a phone call to customer service would have played out.
Takeaway: Use visuals when the answer to a consumer question involves relationships between more than two variables.
GoEuro Travel

Consumer need: What is the best available transport between two destinations?
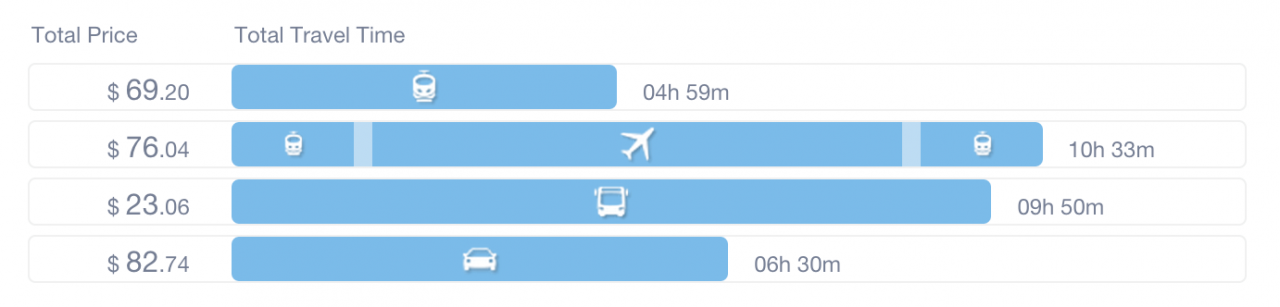
People choose their means of transport according to different needs and preferences. In this example from GoEuro you can see that at $23.06 it is cheaper to travel by bus but the trip takes almost 10 hours. I’m travelling with two young children so a 10hour bus trip is my worst nightmare.
I’m looking for a combination of a quick mode of travel, preferably direct and affordable. In this example the train is the way to go. It is the second cheapest and the fastest way to reach our destination. I probably would have assumed flying was quicker!
The best bit is I didn’t have to trawl through endless options to figure that out for myself. This nice little visual at the top of the page tells me that easily. If I click on the train bar, I’m shown only those options making it faster and easier to ultimately book.
Takeaway: Use visuals when there are multiple answers to a consumer need.
Eurostar discount fares
Consumer need: Can I book one of your promotional fares?
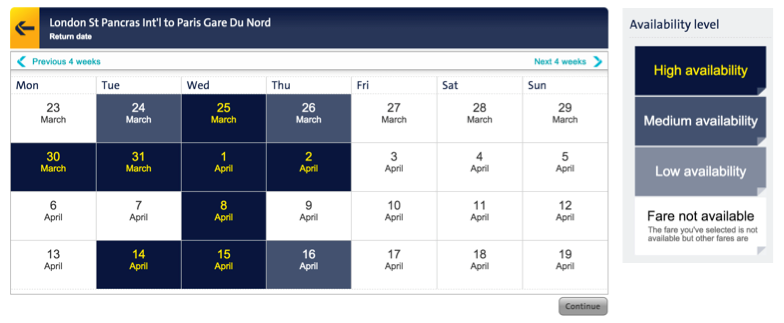
The travel industry is notorious for promoting highly sought after discounted fares. However they are not so great at communicating the availability of these discounted fares. Not so with Eurostar.
Their neat colour-coded calendar means I can easily see how likely I am to access the promotional fares. Even better, I can see if flexibility with my travel dates will make things cheaper.
Takeaway: Use visuals when they can save your audience time and reduce frustration.
The human brain can process visuals 60,000 times faster than text. Incorporating visuals in the consumer journey can be a useful way to help your audience digest information and make decisions, ultimately boosting conversions.
If you have come across any great examples of useful visuals along the path to purchase please comment below. I’d love to see them.