One thing that is often missed in the debate over the best media measurement is the importance of providing the market with an accurate macro picture of how people are consuming media. While day-to-day focus is often on the size and composition of an individual media brand’s audiences – which is an increasingly difficult task with fragmented distribution across devices and platforms – the accuracy of the total market is often lost.
This is why having an industry-driven approach to measuring the market is vital to the industry. It also gives media buyers and advertisers confidence in having a complete view of total media time and not just granular data of media owners who actively participate in a ratings currency.
In Australia we are fortunate to have a research community that is rigorous in its approach to measurement for all media currencies; due, in no small part, to participation and input from people like John Grono, representing the Media Federation of Australia (MFA), and Victor Corones from Magna representing the buy side.
A very clear example of the importance of having an industry-driven, top-down measurement approach is in the different data we seeing for video measurement produced around the globe. Attaining accurate data for video consumption across all screens is a technically difficult challenge and often the data reported for digital video content is only based on those media brands who have actively opted-in (tagged or SDK implementation) to a measurement system.
The rigorous industry approach in Australia and the U.K. is quite similar: In Australia we have digital measurement through IAB and Nielsen with broadcast TV through OzTAM, while in the U.K. BARB looks after broadcast and UKOM looks after digital. In the U.S. the measurement systems through Nielsen and Comscore have introduced new ways to measure video content across screens but often are focused on the individual media brands rather than presenting the complete consumer story.
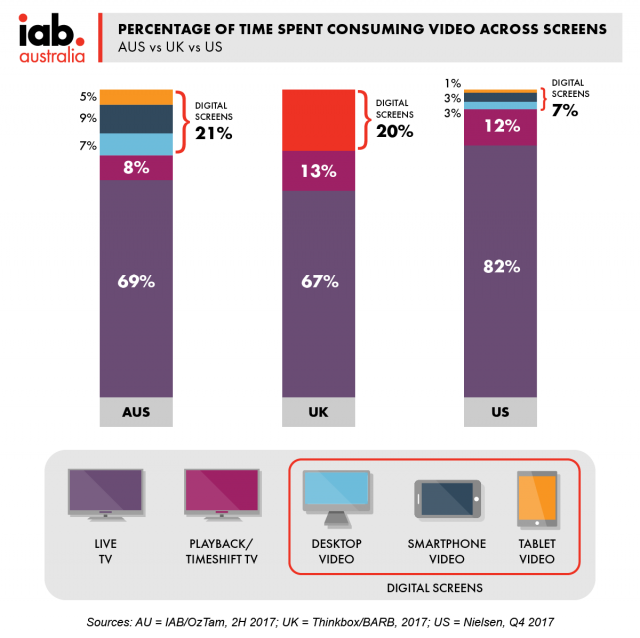
A couple of months back there was market coverage based on 2017 U.S. Nielsen data that seemed to indicate that video consumption on mobile devices was minimal, only 4% across mobile and tablets and 7% across all digital screens. This data just didn’t sit right with me, particularly as the IAB Measurement Council and Nielsen locally have done a lot of work to ensure we are getting an accurate market view and have first-hand experience on how tricky it is to get data on mobile video consumption.
When comparing the Australian and U.K. markets I was pleased to see similar numbers coming through for digital devices as a share of total video-consumption time (21% in Australia and 20% in the U.K.), compared to 7% in the U.S. Marketers and media buyers need always ask the question when looking consumption data: “What is not included in these numbers?”
